What follows is a small collection of images which represent sound or the idea of sound in one way or another, but not as the usual 2D sound waves (see “Stealth Iconography: The Waveform” by Rob Walker). Most of the images collected here share the following three criteria:
- They are either in the public domain or shared under a Creative Commons license;
- They are available in large format (the copies hosted here are smaller/lower resolution);
- Detailed references are provided.
• • •
-
Ernst Chladni’s original illustrations of various patterns produced when sand placed on a plate is vibrated at a given frequency (“Chladni’s figures”) are available over at Monoskop (1,925 × 2,431 px). The plates are extracted from two books by Chladni: Die Akustik, 1802 (a French translation from 1809, Traité d’acoustique, is available at BNF’s Gallica and on Google Books as well) and Entdeckungen über die Theorie des Klanges, 1787 (Google Books, ETH-Bibliothek, ECHO). More reproduction (white sand on black plate) can be found in Charles Wheatstone’s 1833 Proceedings of the Royal Society of London “On the Figures Obtained by Strewing Sand on Vibrating Surfaces, Commonly Called Acoustic Figures”. Everything from those books is public domain. For another take on Chladni’s figures, see also “80 Mesh – La Forma del Suono” by the collective Marte.


-
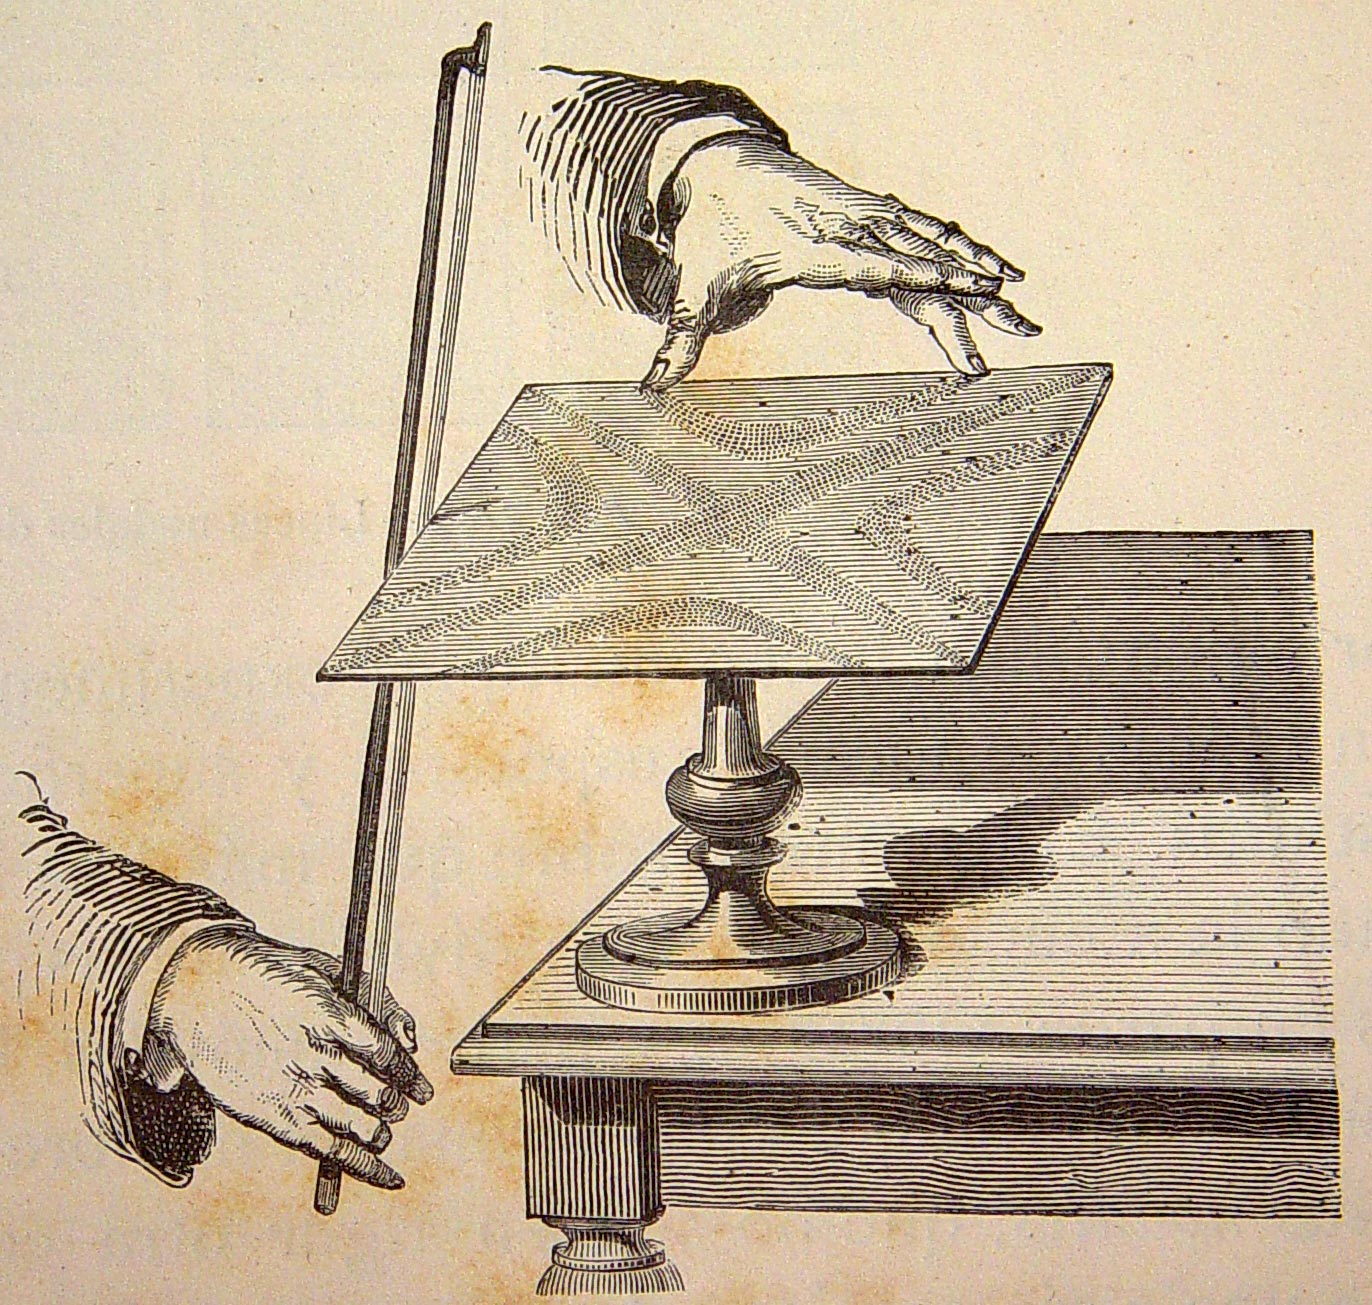
The etching of an illustration showing how to vibrate such a plate is reproduced in W. H. Stone Elementary Lessons on Sound (1879) on p. 25. However, a much larger and nicer reproduction is included in the Flickr account of Biblioteca de la Facultad de Derecho y Ciencias del Trabajo de la Universidad de Sevilla: “Vibración de una placa”. The image comes from the first tome of El mundo físico : gravedad, gravitación, luz, calor, electricidad, magnetismo, etc (also available on Google Books) They have a whole set of vintage illustrations (engravings and etchings) in large format from El mundo físico (Tome 1 and 2) and other sources as well. In fact, their whole collection is amazing and all their images are released under the CC BY 2.0 license.

-
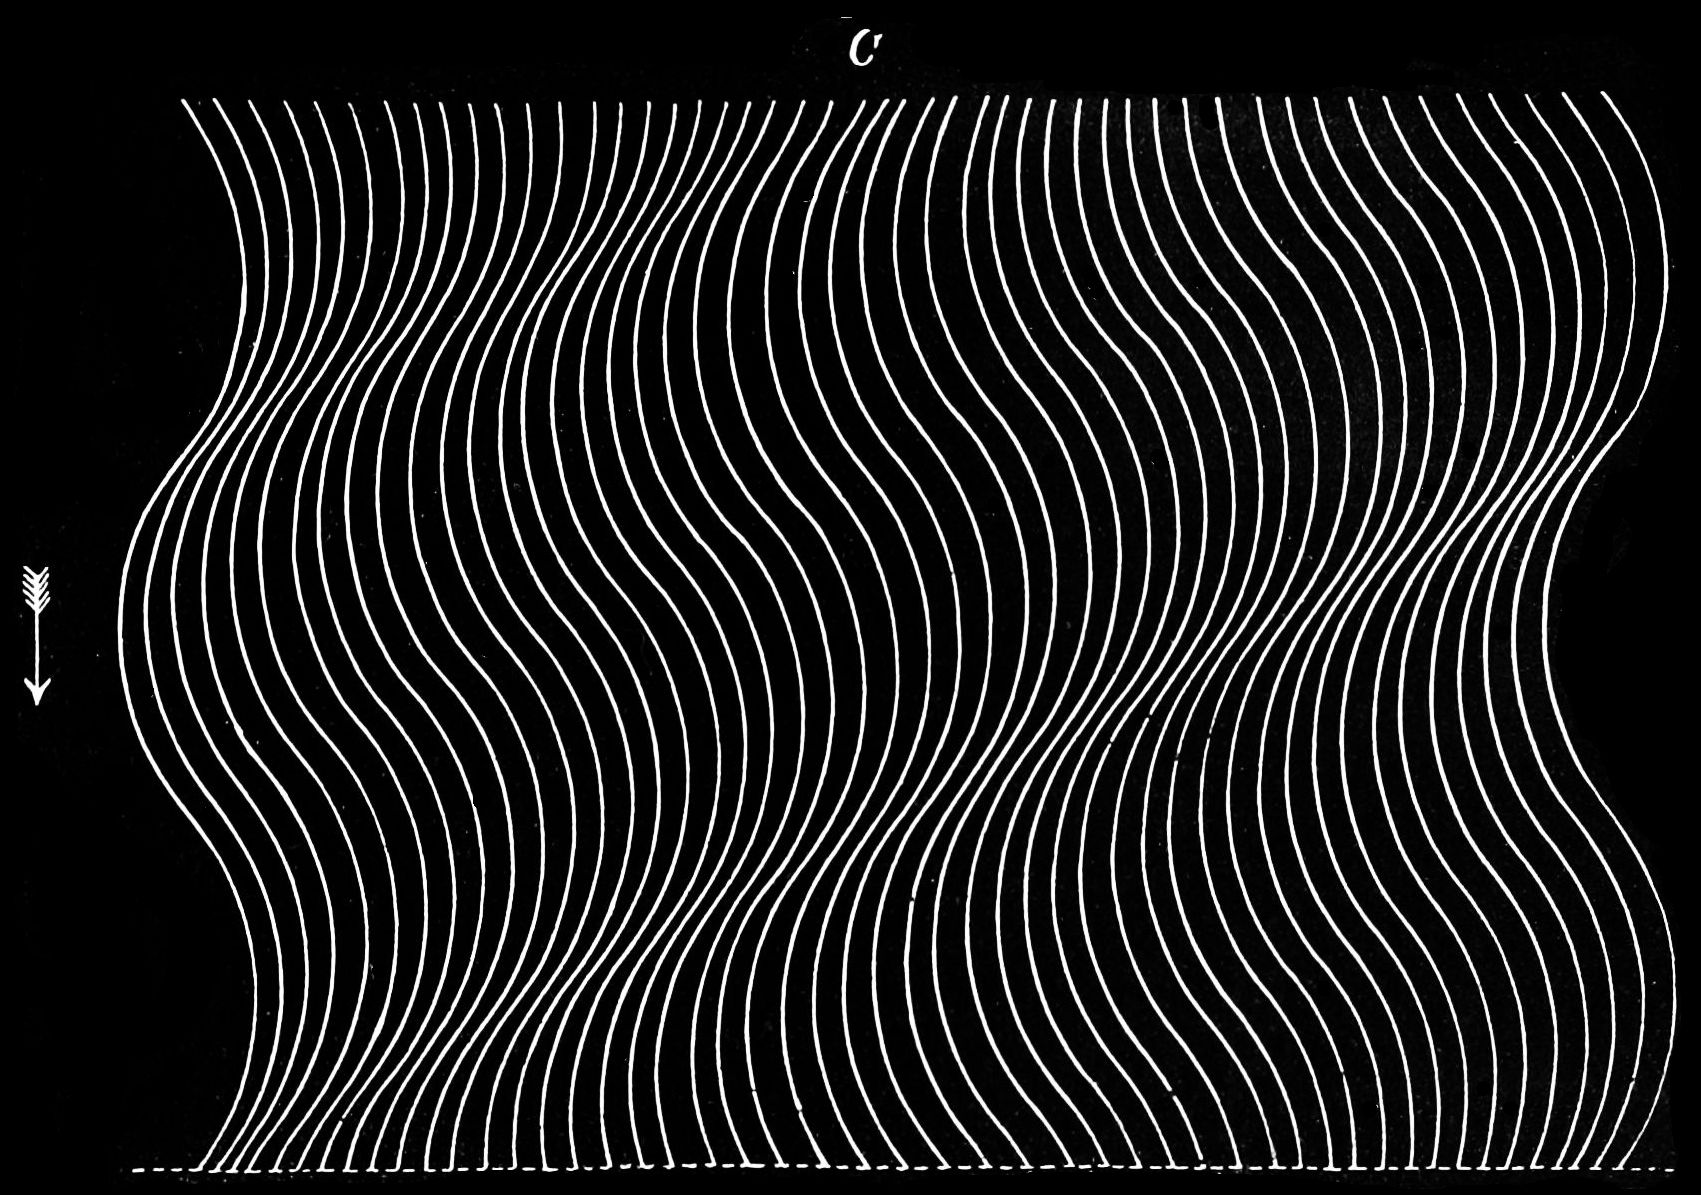
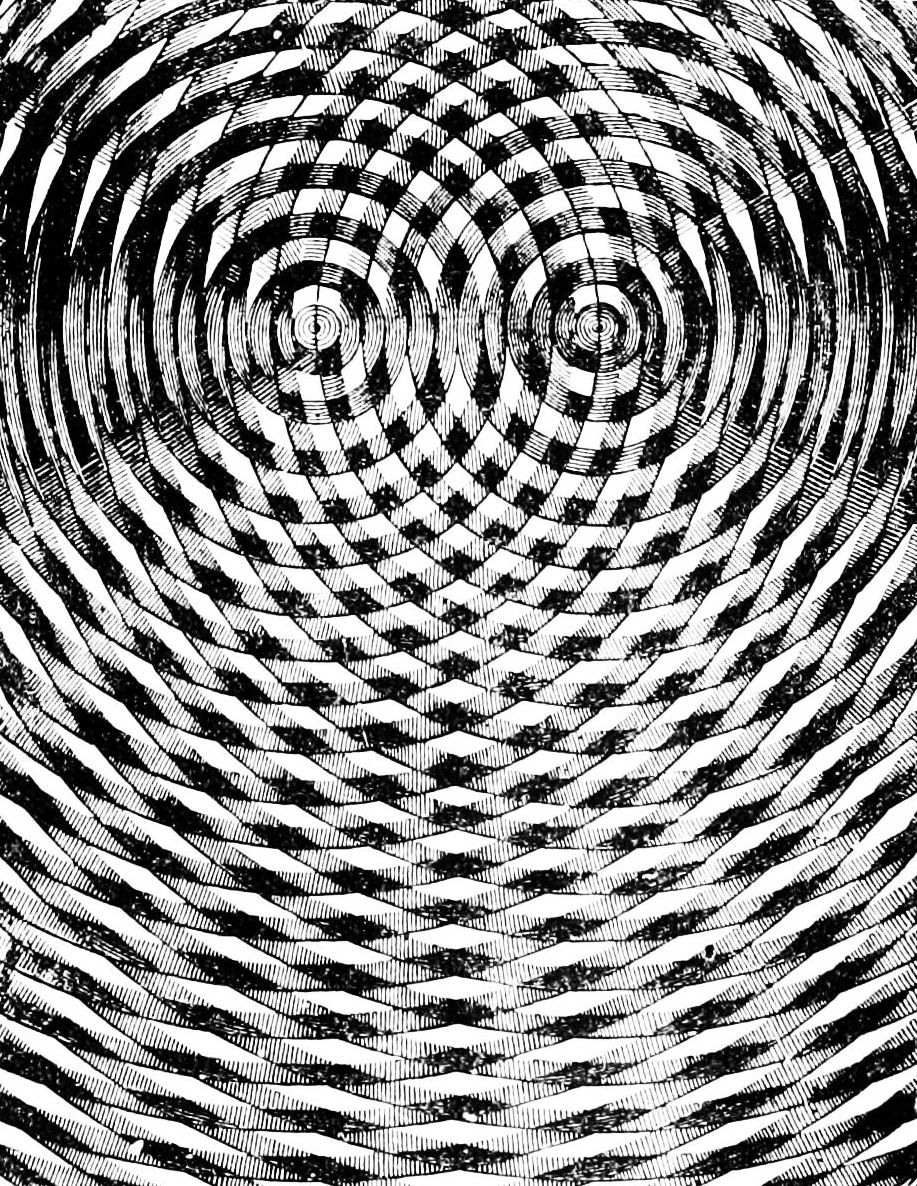
Joseph Norman Lockyer gathered a variety of interesting illustration in a paper titled “Water-Waves and Sound-Waves” which was published in Volume 13 of Popular Science Monthly, on June 1878 (pp. 166-173). Some of the illustrations used by Lockyer are woodcuts first published in Adolf F. Weinhold’s book Vorschule der Experimental physik (Leipzig, 1871). Both documents are entirely in the public domain.
The first illustration below reminded me of the iconic design produced by Peter Saville for the cover of Joy Division’s album “Unknown Pleasures” (see the story on Vimeo).
-
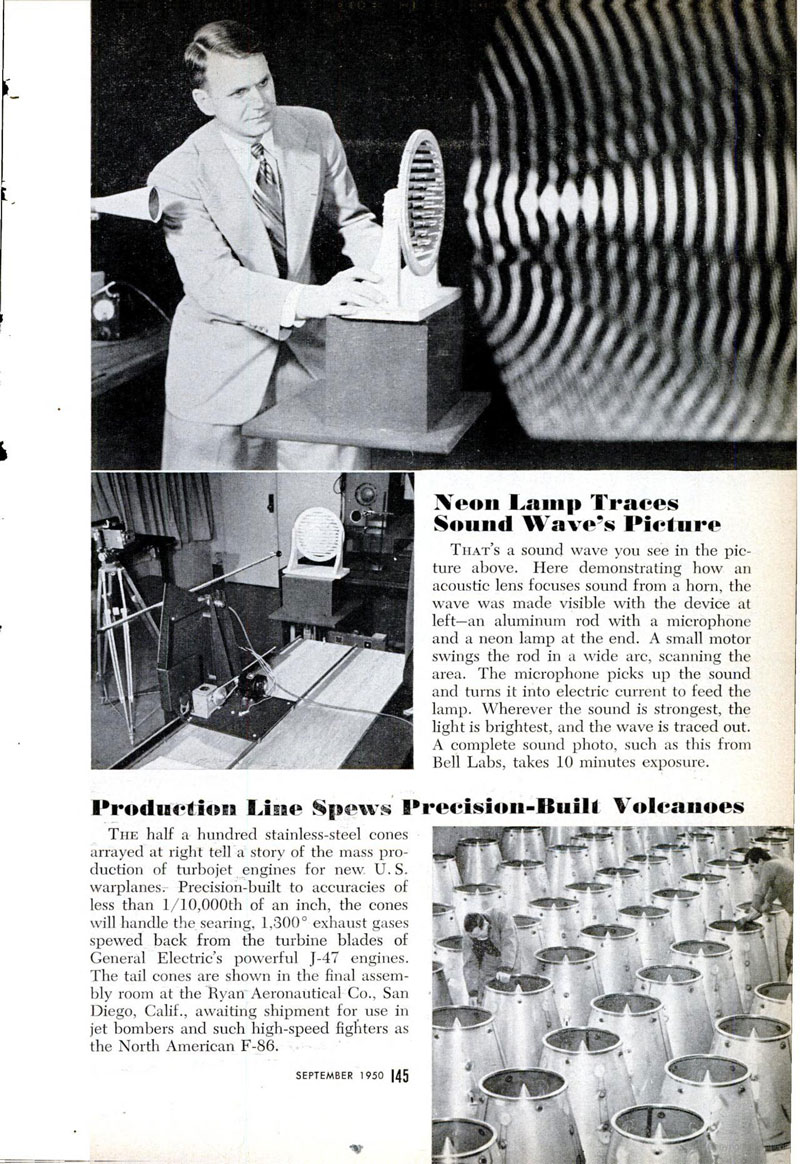
“Neon Lamp Traces Sound Wave’s Picture” (below) was produced by Bell Labs and published in the September 1950 issue of Popular Science (p. 145). This is very likely to be in the public domain (see here for more information). The original paper for the study by Bell Labs is available online as a PDF document: “A Photographic Method for Displaying Sound Wave and Microwave Space Patterns” by W. E. Kock and F. K. Harvey (October 27, 1950).
-
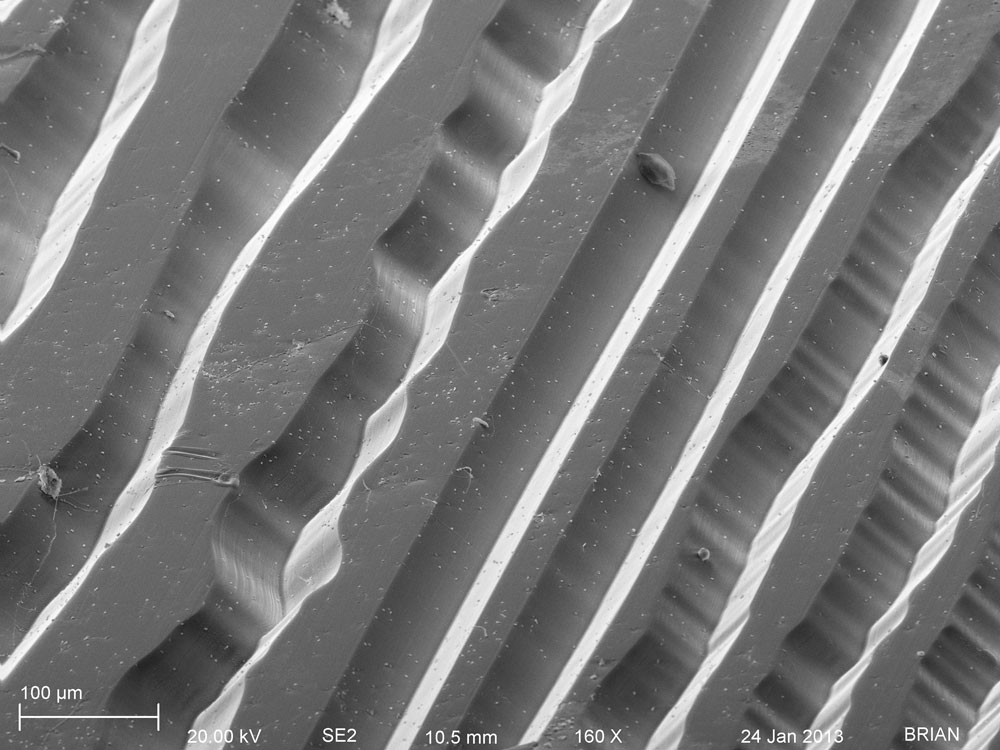
A few years ago, while working at the University of Rochester Institute for Optics, Chris Supranowitz produced very nice micrographs of vinyl record grooves using a scanning electron microscope combine along with his own experimental post-processing techniques. Detailed explanations of the experiment, along with samples from the results are available online: “Micrograph Acquisition Post-Processing Techniques”. Large format of six of those images are available here in TIFF format (3072 x 2304 px, each file is 6.8 MB). Publishing is allowed as long each images is properly attributed: for example “Image courtesy of University of Rochester: URnano”. Supranowitz also produced micrographs of CD pits which, alongside the grooves, allows for a nice visual comparison between analog recording and digital recording.